F2 – Chapter 1- The Nature, Source, and Purpose of Management Information
Topic 1: Accounting for management
In the dynamic business landscape, navigating the complexities of managerial decision-making requires reliable and insightful information. This in-depth exploration delves into the purpose and role of management accounting, its distinction from financial accounting, and its crucial contribution to planning, control, and informed decision-making, while acknowledging its inherent limitations.
A. Unveiling the Power of Cost and Management Accounting:
- Purpose: Provides detailed information about an organization’s costs, activities, and performance, supporting decision-making, planning, and control beyond financial reporting.
- Role:
- Cost analysis: Identifies, measures, and analyzes costs associated with products, services, departments, and activities.
- Performance evaluation: Assesses and measures the effectiveness and efficiency of operations.
- Planning and budgeting: Formulates budgets, forecasts future performance, and supports strategic decision-making.
- Control and profitability improvement: Identifies areas for cost reduction and performance improvement.
Illustration: A manufacturing company utilizes cost accounting to determine product profitability, identify cost-saving opportunities, and develop budgets for future production, optimizing resource allocation and maximizing profitability.
B. Contrasting Financial and Management Accounting:
| Feature | Financial Accounting | Management Accounting |
| Primary users | External stakeholders (investors, creditors, regulators) | Internal managers |
| Focus | Historical financial performance | Future performance and decision-making |
| Regulations | Adheres to strict accounting standards | Adaptable to specific organizational needs |
| Level of detail | Aggregated financial statements | Detailed cost and activity data |
| Reporting frequency | Periodic (quarterly, annually) | Continuous and flexible |
C. Navigating the Planning, Decision-Making, and Control Cycle:
I) Planning: Management accounting facilitates setting strategic, tactical, and operational goals by:
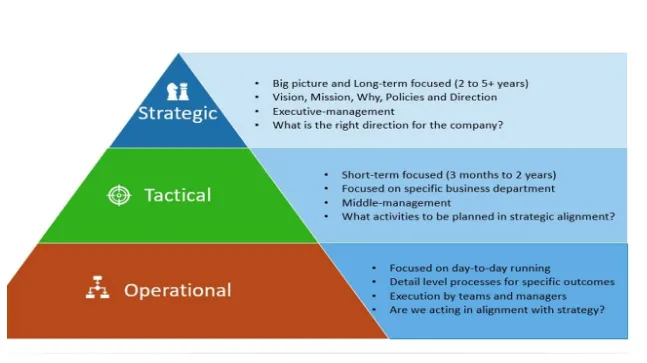
- Strategic planning: Analyzing long-term trends, competitor analysis, and market potential to define overall direction.
- Tactical planning: Budgeting resource allocation for specific departments or projects to achieve strategic goals.
- Operational planning: Establishing detailed plans for day-to-day activities and resource utilization.
II) Decision-Making: Cost and performance information empowers managers to:
-
- Identify profitable products and services: Allocate resources strategically based on profitability analysis.
- Evaluate investment opportunities: Assess capital budgeting proposals based on projected costs and financial returns.
- Set effective pricing strategies: Analyze cost structures and competitor pricing to optimize pricing decisions.
III) Control: Management accounting enables monitoring and adjusting plans by:
-
- Comparing actual performance to budget: Identify variances and investigate potential problems.
- Taking corrective actions: Implement measures to address deviations and control costs.
- Evaluating operational efficiency: Analyze performance metrics to identify areas for improvement.
Illustration: A retail chain utilizes cost accounting to identify underperforming product lines, adjust pricing strategies, and implement cost-saving measures, improving overall profitability and control over operations.
D. Differentiating Planning Horizons:
- Strategic planning: Long-term (3-5 years), focuses on overall business direction and competitive advantage.
- Tactical planning: Mid-term (1-3 years), translates strategic goals into specific objectives and resource allocation plans.
- Operational planning: Short-term (days, weeks, months), defines detailed execution plans for day-to-day activities.
E. Data vs. Information: Recognizing the Distinction:
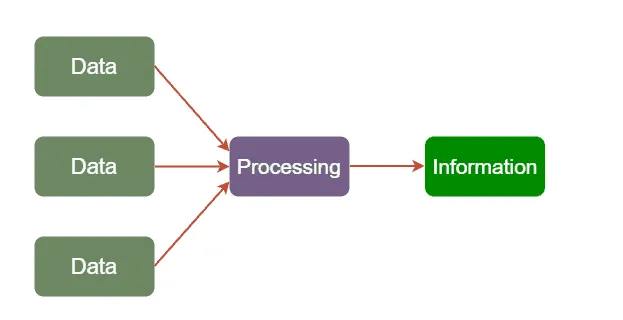
- Data: Raw, unprocessed facts and figures.
- Information: Data that has been processed, formatted, and presented in a meaningful way, providing context and value to users.
Illustration: Sales figures (data) become valuable information when analyzed by product category, customer segment, and profitability, providing insights for sales strategy and resource allocation
F. Hallmarks of Good Management Information:
- Accurate: Free from errors and reflects the true state of affairs.
- Relevant: Addresses the specific needs and questions of the user.
- Complete: Provides all the necessary information to make informed decisions.
- Timely: Available when needed for decision-making.
- Understandable: Presented in a clear and concise format that users can easily comprehend.
G. Acknowledging the Limitations of Management Information:
- Uncertainty: Future events may not unfold as predicted, and information may become outdated.
- Subjectivity: Judgments and assumptions used in gathering or interpreting data can introduce bias.
- Incomplete: No information system can capture all relevant factors impacting decision-making.
Illustration: A cost analysis may not fully capture the qualitative aspects of customer preferences, potentially leading to suboptimal decisions if over-relying on purely cost-based information.
Topic 2. Sources of data
In the dynamic world of business, management accounting relies heavily on accurate and relevant information to fuel informed decision-making. This in-depth exploration delves into the diverse sources of data available, both internal and external, and examines their uses, limitations, and cost considerations
A. Unveiling the Three Main Data Sources:
-
Machine/Sensor Data:

- Description: Continuous data generated by machines, sensors, and automated systems (e.g., production output, equipment performance, energy consumption).
- Uses: Real-time monitoring, performance evaluation, predictive maintenance, process optimization.
- Limitations: Requires data security measures, potential integration challenges with existing systems, data overload.
- Illustration: A manufacturing plant uses sensor data to monitor machine performance, predict potential failures, and schedule preventive maintenance, reducing downtime and production costs.
-
Transactional Data:
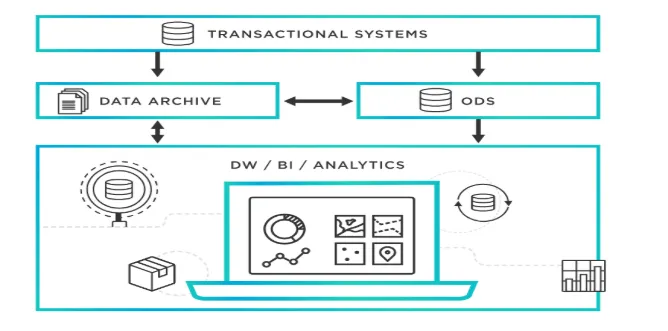
- Description: Data generated from business transactions (e.g., sales invoices, purchase orders, payroll records, expenses).
- Uses: Financial reporting, cost analysis, profitability assessment, inventory management.
- Limitations: Accuracy depends on data entry quality, may require cleansing and standardization for further analysis.
- Illustration: A retail store analyzes sales transaction data to identify best-selling products, optimize pricing strategies, and manage inventory levels, maximizing sales and profitabilit
-
Human/Social Data:
- Description: Information gathered from human interaction and engagement (e.g., surveys, customer feedback, employee reports, social media sentiment analysis).
- Uses: Market research, customer satisfaction assessment, employee engagement evaluation, brand reputation monitoring.
- Limitations: Subjectivity of responses, potential sampling bias, ethical considerations for data collection and usage.
- Illustration: A company conducts employee surveys to gauge morale, identify areas for improvement, and implement programs to enhance employee engagement, leading to improved productivity and reduced turnover.
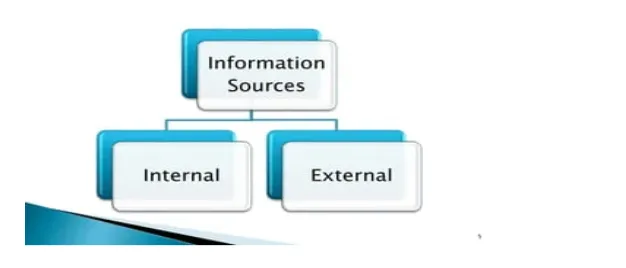
B. Exploring Internal/ External Information Sources v Primary and Secondary Sources:
-
Internal Sources:
- Accounting records: General ledger, sub-ledgers, budgets, forecasts, cost reports.
- Sales & marketing data: Customer relationship management (CRM) systems, sales records, customer feedback.
- Operations data: Production records, inventory levels, machine performance data.
- Human resources data: Payroll records, employee performance evaluations, training records.
-
External Sources:
- Government statistics: Industry reports, economic data, demographic information.
- Financial press: Business news, company reports, analyst commentaries.
- Professional/trade associations: Industry benchmarks, research reports, best practices guides.
- Quotations and price lists: Supplier catalogs, industry databases, online marketplaces.
Primary vs Secondary Sources
I) Primary Sources
Definition: Original data collected firsthand for a specific purpose
Examples:
- Surveys and questionnaires
- Interviews with customers/staff
- Direct observations
- Internal company records (sales data, timesheets)
- Experiments and tests
Advantages: Tailored to your needs, current, exclusive Disadvantages: Time-consuming, expensive to collect
II) Secondary Sources
Definition: Data already collected by others for different purposes
Examples:
- Government statistics
- Industry reports
- Published research
- Competitor websites
- Trade journals and newspapers
Advantages: Quick, cheap, readily available Disadvantages: May be outdated, not specific to your needs, available to competitors
C. Using Published Information Wisely:
Uses:
- Benchmarking: Compare own performance with industry averages.
- Market research: Understand market trends, competitor analysis, identify new opportunities.
- Investment decisions: Analyze financial reports, evaluate company performance.
- Stay informed: Keep up with industry news, regulatory changes, emerging trends.
Limitations:
- Accuracy: Verify information source and credibility, be cautious of biased reporting.
- Relevance: Ensure information is applicable to your specific industry and context.
- Timeliness: Information may be outdated, consider publication date and potential changes.
- Accessibility: Some information may require subscriptions or fees for access.
Illustration: A startup company utilizes industry reports from a trade association to understand market size, customer preferences, and competitor offerings, informing their product development and market entry strategy.
D. Data Capture Costs of Management Accounting Information:
Definition
Data capture costs = costs incurred in collecting, recording, and processing information for management accounting purposes
Types of Data Capture Costs
- Direct Costs
- Salaries of data entry staff
- Cost of data collection forms/software
- Equipment costs (scanners, computers)
- Storage costs (servers, cloud storage)
- Training costs for data handlers
- Indirect Costs
- Time spent by operational staff recording data
- System maintenance and updates
- Data verification and quality checks
- Lost productivity during data collection
Key Considerations
Cost vs Benefit Analysis
Information should only be collected if:
- Benefits > Costs
- The information improves decision-making
- It provides competitive advantage
- It’s required by law/regulation
Factors Affecting Data Capture Costs
Higher costs when:
- Primary sources used (vs secondary)
- Manual data entry (vs automated)
- High accuracy requirements
- Real-time data needed
- Large data volumes
- Complex data formats
Lower costs when:
- Automated systems in place
- Integrated IT systems
- Secondary sources available
- Simple, standardized formats
Cost Reduction Strategies
- Automate data capture (barcode scanners, RFID)
- Integrate systems to avoid duplicate entry
- Standardize data formats across organization
- Use exception reporting (only capture unusual items)
- Sampling instead of 100% data collection
Topic 3. Cost classification
In the intricate world of management accounting, understanding cost classifications and behaviors is fundamental to informed decision-making. This in-depth exploration delves into the distinction between production and non-production costs, delves into various cost elements, highlights their importance in valuing output and inventories, and explains additional cost classifications for insightful analysis.
A. Production vs. Non-Production Costs:
Production Costs: Costs directly involved in manufacturing products or providing services.
- Illustration: Raw materials used in a product, direct labor costs for manufacturing, energy consumed during production.
Non-Production Costs: Costs not directly involved in production but necessary for running the business.
- Illustration: Rental expenses for office space, marketing and advertising costs, salaries of administrative staff.
Distinguishing between these is crucial for:
- Inventory valuation: Only production costs are capitalized and included in the cost of inventory.
- Profitability analysis: Understanding how each cost impacts overall profit margin.
- Decision-making: Identifying cost-saving opportunities in specific areas.
B. Unveiling the Non-Production Cost Elements:
- Administrative Costs: Expenses related to general management and organization of the business.
- Examples: Salaries of administrative staff, accounting fees, legal fees.
- Selling Costs: Expenses incurred to promote and sell products or services.
- Examples: Advertising costs, sales commissions, salaries of sales staff.
- Distribution Costs: Expenses associated with delivering products or services to customers.
- Examples: Transportation costs, warehousing costs, customer service costs.
- Finance Costs: Expenses related to borrowing money and managing finances.
- Examples: Interest on loans, bank charges, foreign exchange losses.
C. Decoding Production Cost Elements:
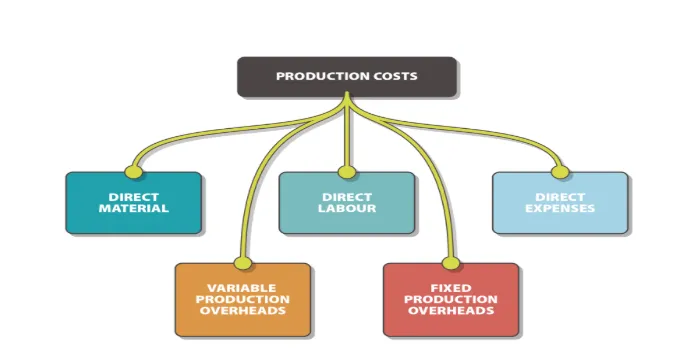
- Direct Materials: Materials directly identifiable with a specific product or service.
- Illustration: Fabric used in a garment, wood used in furniture.
- Direct Labor: Wages paid to employees directly involved in production.
- Illustration: Wages of assembly line workers, salaries of surgeons.
- Overheads (Indirect Costs): Production costs not directly attributable to a specific product or service, allocated using various methods.
- Examples: Factory rent, electricity costs, depreciation of production equipment.
D. Valuing Inventory and Profits:
- Only production costs (materials, labor, overheads) are included in the cost of inventory.
- Non-production costs are expensed in the period they are incurred, affecting the current period’s profit.
- Understanding this distinction ensures accurate inventory valuation and reflects true profitability.
E. Exploring Additional Cost Classifications:
- By Function: Classifies costs according to their business function (e.g., production, marketing, administration).
- Direct vs. Indirect: Direct costs are traceable to specific cost objects (products, services), while indirect costs are allocated using various methods.
- Fixed vs. Variable: Fixed costs remain constant regardless of activity level, while variable costs change with activity level.
- Stepped Fixed Costs: Change in fixed cost amounts only at specific activity levels.
- Semi-Variable Costs: Have both fixed and variable components.
Illustration: Rent is a fixed cost, while direct labor is a variable cost. Electricity might be a stepped fixed cost, changing at specific usage levels.
F. Categorizing Transactions with Codes:
- Unique codes assigned to different cost categories ensure accurate data capture and analysis.
- These codes facilitate filtering and reporting based on specific cost elements or classifications.
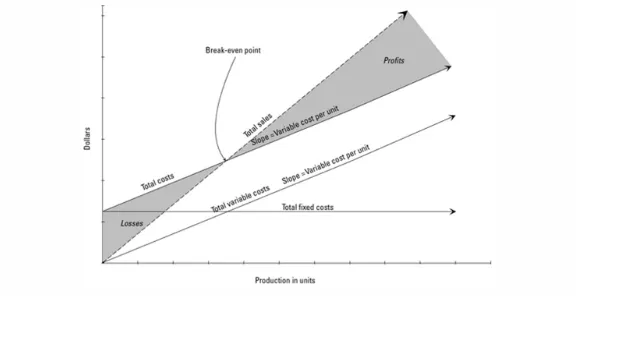
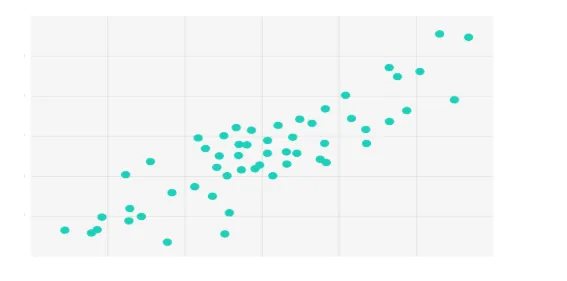
G. Visualizing Cost Behavior:
- Cost behavior can be illustrated using graphs like scatter plots, cost-volume-profit (CVP) charts, and break-even charts.
Cost-volume-profit Chart
Break-even chart
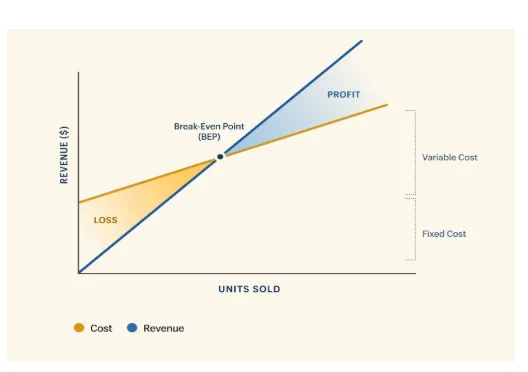
- These visual representations help understand how costs change with activity levels and make informed pricing and production decisions.
H. Cost Objects, Units, and Centers:
- Cost object: Anything for which costs are accumulated (e.g., product, service, project).
- Cost unit: The unit of measurement used to express the cost of a cost object (e.g., per unit, per hour).
- Cost center: A department or area where costs are incurred and monitored (e.g., production department, marketing department).
I. Profit vs. Cost vs. Investment vs. Revenue Centers:
- Cost center: Incurred costs (e.g., production department).
- Profit center: Generates revenue and incurs costs, measured by profit (e.g., sales department).
- Investment center: Focuses on long-term investments and returns (e.g., research and development department).
- Revenue center: Generates revenue but may not incur significant costs
J. Information Needs for Different Center Managers:
- Cost center managers: Focus on controlling and minimizing costs within their department. Need information on cost variances, resource utilization, and efficiency metrics.
- Profit center managers: Responsible for both revenue generation and cost control. Need information on sales volume, profitability by product or service, and marketing effectiveness.
- Investment center managers: Evaluate long-term investments and returns. Need information on project profitability, return on investment (ROI), and risk assessments.
- Revenue center managers: Primarily concerned with generating revenue. Need information on customer segments, sales performance, and marketing campaign effectiveness.
Topic 4. Presenting information
In the dynamic world of business, presenting management information in a clear, concise, and insightful manner is crucial for informed decision-making. This in-depth exploration delves into crafting impactful written reports and utilizing data visualization techniques to transform data into meaningful understanding.
A. Tailoring Written Reports for Purpose:
Format and Style:
- Formal reports: Detailed analysis with supporting evidence, tables, and charts for complex issues or high-level audiences.
- Informal reports: Summarized information and key findings for operational updates or internal communication.
- Bulletins/memorandums: Concise updates on specific issues or action items.
Key Considerations:
- Audience: Tailor language, level of detail, and tone to the specific audience (e.g., senior management, operational managers, external stakeholders).
- Purpose: Clearly define the report’s objective and what conclusions or recommendations it aims to present.
- Content:
- Executive summary: Concise overview of key findings and recommendations.
- Main body: Presents detailed analysis, evidence, and explanations.
- Conclusions and recommendations: Summarize key takeaways and actionable suggestions.
- Appendices: Include supporting data, detailed calculations, or additional information not essential for the main body.
Illustration: A cost analysis report for senior management would be a formal document with detailed cost breakdowns, charts, and recommendations for cost reduction, while a daily sales report for internal communication might be an informal email highlighting key sales figures and trends.
B. Harnessing the Power of Data Visualization:
Choosing the Right Chart:
- Bar charts: Effective for comparing categories, highlighting differences in magnitude.

- Line graphs: Track trends and changes over time, identify patterns and relationships.

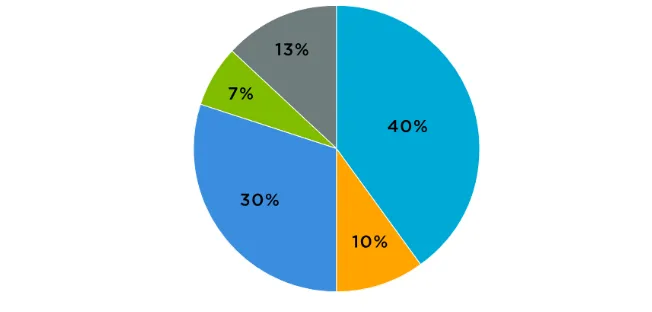
- Pie charts: Represent proportions within a whole, best for limited categories.
- Scatter graphs: Reveal correlations or relationships between two variables.
Additional Considerations:
- Clarity and labeling: Ensure charts are clear, well-labeled, and easy to understand.
- Color choice: Use colors effectively to enhance clarity and avoid misleading interpretations.
- Context and explanation: Provide context and interpretation alongside the visualization to ensure proper understanding.
Illustration: A line graph showcasing monthly sales trends over a year helps identify seasonality and inform sales forecasting, while a bar chart comparing marketing campaign performance across different channels enables evaluating campaign effectiveness.
C. Decoding Information from Reports and Visualizations:
Critical Reading and Analysis:
- Identify key trends, patterns, and relationships.
- Evaluate the strength and limitations of the data and analysis.
- Consider potential biases or underlying assumptions.
- Formulate questions and seek clarification as needed.
Interpreting Visualizations:
- Understand the type of chart and its purpose.
- Read and interpret the axes, labels, and legends carefully.
- Identify major trends, outliers, and areas of interest.
- Draw conclusions and insights based on the visualization within the context of the larger report.
Illustration: Recognizing a downward trend in customer satisfaction ratings in a pie chart would prompt further investigation into the contributing factors and potential solutions mentioned in the accompanying report.