F2 – Chapter 2- Data analysis and statistical techniques
Data analysis and statistical techniques
Key Points to Highlight in Chapter 2
Mean as a Measure of Central Tendency:
- The mean represents the average value of a dataset and is used to measure its central tendency. Calculated by summing all values and dividing by the number of observations, the mean provides valuable insight into the typical value or average performance of a variable.
Standard Deviation and Variability:
- Standard deviation measures the dispersion or variability within a dataset. It quantifies how much individual data points deviate from the mean, with higher standard deviations indicating greater variability and lower ones suggesting more consistency among the data points.
Correlation Analysis for Relationship Identification:
- Correlation analysis identifies the strength and direction of the relationship between two variables. Represented by the correlation coefficient, it helps understand the degree of association between variables, aiding in prediction based on historical data.
Regression Analysis for Prediction:
- Regression analysis predicts the value of a dependent variable based on one or more independent variables. It generates a regression equation describing the relationship between variables, facilitating estimation of the dependent variable’s value given specific independent variable values.
Data Analysis for Informed Decision-making:
- Data analysis provides insights crucial for informed decision-making in business contexts. By analyzing trends, patterns, and relationships in data, decision-makers can identify opportunities, assess risks, and evaluate alternative courses of action, enhancing decision accuracy and minimizing uncertainty.
Understanding Dispersion with Standard Deviation:
- Standard deviation assesses the dispersion of data points around the mean. By quantifying variability, it aids analysts in understanding the distribution and volatility of data, enabling better decision-making and risk assessment.
Time Series Analysis for Trend Identification:
- Time series analysis identifies patterns and trends in successive time-period data. It helps forecast future outcomes by recognizing historical trends and seasonal variations, making it valuable for decision-making in finance, economics, and marketing.
Assessment of Central Tendency with Median:
- The median represents the middle value in a dataset and is unaffected by extreme values or outliers, providing a robust measure of central tendency. It divides the dataset into equal halves, aiding in summarizing data distribution.
Probability Distribution for Risk Assessment:
- Probability distribution describes the likelihood of outcomes of a random variable occurring, enabling analysts to assess risk and uncertainty. By quantifying probabilities, it helps estimate expected values and develop strategies to mitigate potential losses or maximize gains.
Statistical Techniques for Group Comparison:
- T-tests and ANOVA are statistical techniques used to compare means among groups. While t-tests compare means of two independent groups, ANOVA compares means of three or more groups, helping assess significant differences between them.
Hypothesis Testing for Statement Evaluation:
- Hypothesis testing evaluates the validity of statements or hypotheses about population parameters. By formulating null and alternative hypotheses and collecting data, analysts determine whether evidence supports rejecting the null hypothesis in favor of the alternative.
Confidence Interval for Population Parameter Estimation:
- Confidence intervals estimate population parameters based on sample data, providing a range of values likely to contain the true parameter value with a specified level of confidence. They aid analysts in assessing sample estimate precision and reliability.
Interpreting p-values in Hypothesis Testing:
- In hypothesis testing, p-values indicate the probability of observing a test statistic as extreme as or more extreme than the one calculated from sample data, assuming the null hypothesis is true. Smaller p-values suggest stronger evidence against the null hypothesis, guiding decision-making in hypothesis testing.
Chi-square Test for Categorical Variable Relationships:
- The Chi-square test assesses the association or independence between two categorical variables by comparing observed and expected frequencies in a contingency table. It helps determine significant relationships between variables, aiding decision-making in research and data analysis.
Understanding F-statistic in ANOVA:
- The F-statistic in ANOVA measures the ratio of variability between groups to variability within groups, assessing significant differences in means among multiple groups. A larger F-statistic indicates greater differences between groups, guiding decisions on rejecting the null hypothesis.
Role of Coefficient of Determination in Regression Analysis:
- The coefficient of determination (R-squared) measures the proportion of variance in the dependent variable explained by independent variables in a regression model. It represents the strength and goodness-of-fit of the regression model, aiding in assessing predictive power and reliability.
Utilizing Statistical Techniques for Categorical Variable Analysis:
- Statistical techniques such as t-tests, ANOVA, and Chi-square tests are used to assess relationships between categorical and continuous variables, aiding decision-making in various research and analytical contexts.
Statistical Techniques for Predictive Modeling:
- Regression analysis and time series analysis are utilized for predictive modeling, enabling forecast of future outcomes based on historical data patterns and trends. These techniques support decision-making by providing insights into future scenarios and potential outcomes.
Applying Statistical Techniques for Group Comparison and Relationship Assessment:
- T-tests, ANOVA, correlation analysis, and Chi-square tests are employed to compare groups, assess relationships between variables, and evaluate significance. These techniques aid in decision-making by providing evidence-based insights and supporting informed choices.
Significance of Statistical Techniques in Decision-making:
- Statistical techniques play a crucial role in decision-making by providing data-driven insights and evidence for informed choices. By analyzing data, assessing relationships, and predicting outcomes, these techniques support decision accuracy, minimize uncertainty, and optimize outcomes in diverse business contexts.
Topic 1: Sampling methods
In the vast ocean of data, sampling techniques serve as lifeboats, allowing us to extract valuable insights without examining the entire population. This in-depth exploration delves into the diverse sampling methods available, empowering you to choose the most appropriate approach for your specific data analysis needs.
A. Unveiling the Arsenal of Sampling Techniques:
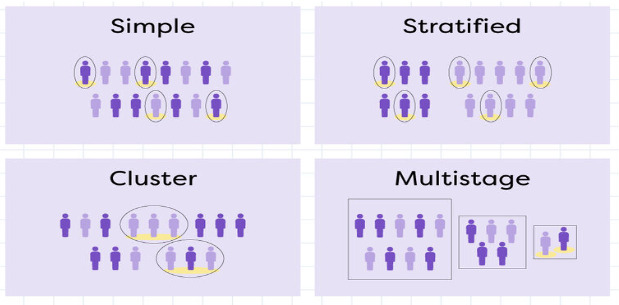
1. Random Sampling:
- Description: Each item in the population has an equal chance of being selected.
- Methods: Simple random sampling, systematic random sampling.
- Advantages: Unbiased, representative of the population if done correctly.
- Disadvantages: Requires a complete list of the population, may not be feasible for large populations.
- Illustration: Selecting 100 customers from a customer database using a random number generator to assess customer satisfaction.
2. Systematic Sampling:
- Description: Selecting items at fixed intervals from a pre-ordered list.
- Advantages: Easier to implement than simple random sampling, may be more representative than convenience sampling.
- Disadvantages: Potential bias if the underlying order is related to the characteristic being studied.
- Illustration: Selecting every 10th invoice from a chronological list to analyze purchase patterns.
3. Stratified Sampling:
- Description: Dividing the population into subgroups (strata) and then selecting samples from each stratum.
- Advantages: Ensures representation of different subgroups within the population, improves accuracy.
- Disadvantages: Requires knowledge of the population subgroups, may be more complex to implement.
- Illustration: Stratifying customers by age group and income level before selecting a sample to analyze buying behavior within each segment.
4. Multistage Sampling:
- Description: Sampling in stages, selecting smaller units from progressively larger units.
- Advantages: Efficient for geographically dispersed populations, reduces travel costs.
- Disadvantages: Potential for increased sampling error at each stage.
- Illustration: Selecting cities, then districts within each city, and finally households within each district to conduct a national survey.
5. Cluster Sampling:
- Description: Selecting naturally occurring groups (clusters) instead of individual items.
- Advantages: Efficient for populations with natural groupings, may be less expensive than individual sampling.
- Disadvantages: Clusters may not be representative of the entire population, potential for bias.
- Illustration: Selecting schools as clusters and surveying all students within each selected school to assess educational attainment levels.
6. Quota Sampling:
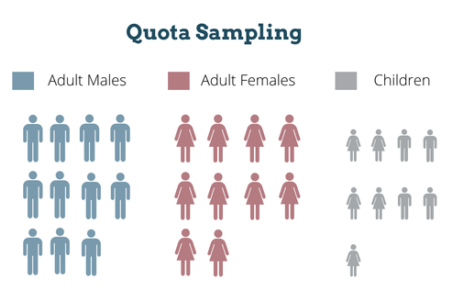
- Description: Selecting items based on predetermined quotas for specific subgroups.
- Advantages: Ensures representation of specific groups, can be quick and convenient.
- Disadvantages: Subjective selection of items, potential for bias, may not be statistically representative.
- Illustration: Interviewing a set number of men and women on the street to gauge public opinion on a current event, without random selection within each group.
B. Choosing the Right Tool for the Job:
The selection of the most appropriate sampling method depends on several factors:
- Population size and characteristics: Is the population large or small? Are there subgroups or natural clusters?
- Sampling frame availability: Do you have a complete list of the population?
- Cost and time constraints: What resources are available for sampling?
- Desired level of accuracy and representativeness: How important is it to obtain unbiased and generalizable results?
By carefully considering these factors and understanding the strengths and weaknesses of each sampling method, you can make informed decisions that ensure the effectiveness and reliability of your data analysis.
Topic 2. Analytical techniques in budgeting and forecasting
In the dynamic world of business, accurate budgeting and forecasting are essential for informed decision-making and financial sustainability. This in-depth exploration delves into key analytical techniques, empowering you to unlock valuable insights and create reliable financial projections.
A. Unveiling the Linear Landscape: Functions and Equations
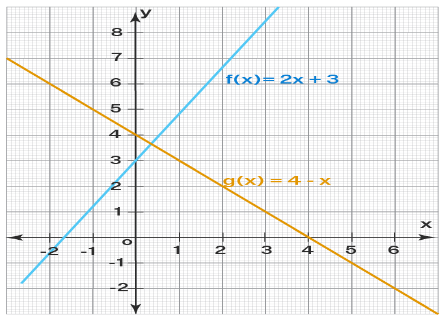
Linear functions, represented as y = mx + b, form the foundation of many budgeting and forecasting techniques. Here’s a breakdown:
- m: Represents the slope, indicating the change in y (dependent variable) for a unit change in x (independent variable). In costing, it often reflects the variable cost per unit.
- b: Represents the y-intercept, indicating the fixed cost component when x is zero (no activity).
Understanding linear functions allows you to model cost behavior, estimate future costs, and evaluate budget assumptions.
B. High-Low Method:
The high-low method is a simple yet effective technique to separate fixed and variable cost components, especially useful when dealing with:
- Semi-variable costs: Costs with both fixed and variable elements, changing in steps rather than proportionally with activity.
- Changes in variable cost per unit: Variable cost per unit might not be constant due to discounts, bulk purchases, or other factors.
C. Weighing the High-Low Method: Advantages and Disadvantages
Advantages:
- Simple and easy to understand.
- Requires minimal data points.
- Useful for estimating semi-variable and stepped fixed costs.
Disadvantages:
- Assumes a linear relationship between activity and cost, which may not always hold true.
- Sensitive to outliers and extreme data points.
- Limited accuracy for complex cost structures.
D. Visualizing Cost Behavior: Scatter Diagrams and Lines of Best Fit
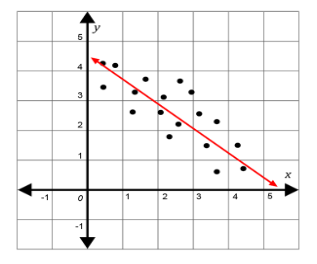
Scatter diagrams plot activity levels (x) against total costs (y), helping visualize cost behavior. Lines of best fit, often calculated using least squares regression, represent the linear relationship between these variables and can be used for:
- Estimating future costs at different activity levels.
- Identifying outliers or unusual data points.
- Evaluating the validity of linear assumptions in the cost model.
Illustration: Plotting the company A data from the previous example in a scatter diagram and fitting a line of best fit can visually confirm the linear relationship and support the estimated costs at different activity levels.
Remember:
- The high-low method is a quick estimation tool, not a perfect science. Consider its limitations and use it in conjunction with other techniques and judgment.
- Scatter diagrams and lines of best fit offer visual insights but may not capture the full complexity of cost behavior. Analyze them critically and consider underlying assumptions.
By combining a solid understanding of linear functions, strategic application of the high-low method, and insightful data visualization techniques, you can transform budgeting and forecasting from mere projections into powerful tools for financial planning and informed decision-making. This exploration equips you with the foundational knowledge, but remember, the journey of mastering these techniques continues with further exploration of more advanced cost estimation methods, time series analysis, and the evolving role of technology in budgeting and forecasting.
Topic 3. Summarizing and analyzing data
In the data-driven world of today, effective summarizing, analyzing, and utilizing information are crucial skills for organizations to thrive. This in-depth exploration delves into the characteristics of big data, explains its diverse forms and uses, and equips you with key statistical tools to extract meaningful insights from your data.
A. Five Defining Big Data Characteristics
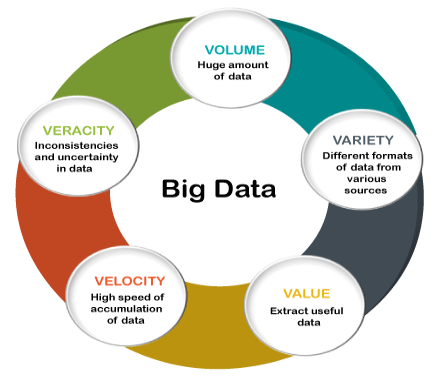
1. Volume: Big data refers to immense datasets, often exceeding traditional storage and processing capabilities. Think terabytes, petabytes, and even exabytes of information!
2. Variety: It encompasses diverse data types, including structured (e.g., databases), semi-structured (e.g., emails), and unstructured (e.g., social media posts).
3. Velocity: Big data is generated and collected at an ever-increasing speed, demanding real-time analysis and decision-making.
4. Value: While raw data alone holds limited value, extracting hidden patterns and insights through analytics unlocks immense potential for organizations.
5. Veracity: Ensuring data accuracy, consistency, and completeness is critical for reliable analysis and deriving meaningful conclusions.
B. Unveiling the Data Spectrum: Structured, Semi-structured, and Unstructured
- Structured Data: Organized within a predefined schema, allowing for efficient querying and analysis (e.g., sales records, financial databases).
- Semi-structured Data: Contains some defined structure but might require parsing or interpretation (e.g., XML files, JSON files).
- Unstructured Data: Lacks a formal structure and requires specialized techniques for processing and analysis (e.g., social media text, images, videos).
C. Harnessing the Power of Big Data: Organizational Applications
- Customer insights: Analyzing customer behavior, preferences, and sentiment to personalize marketing, improve product offerings, and enhance customer experience.
- Operational efficiency: Identifying inefficiencies, optimizing processes, and predicting maintenance needs to reduce costs and improve performance.
- Risk management: Analyzing historical data and trends to predict and mitigate potential risks, ensuring financial stability and operational continuity.
- Fraud detection: Detecting and preventing fraudulent activities using advanced analytics and pattern recognition techniques.
- Innovation and product development: Gaining insights from social media and market trends to develop innovative products and services that meet evolving customer needs.
D. Unveiling Data Types: Categorical and Numerical
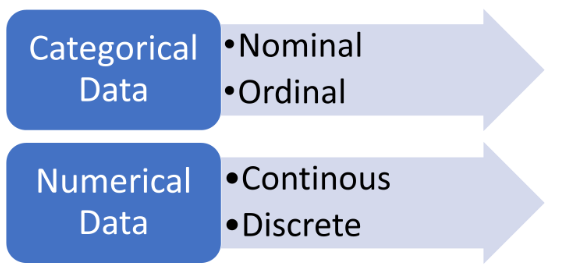
1. Categorical Data: Represents qualitative characteristics and cannot be numerically ordered.
-
- Nominal: Labels or categories without inherent order (e.g., eye color, country).
- Ordinal: Categories with a specific order but equal differences between categories cannot be assumed (e.g., education levels).
2. Numerical Data: Represents quantitative values and can be measured or counted.
-
- Continuous: Can take on any value within a range (e.g., height, weight).
- Discrete: Can only take on specific, distinct values (e.g., number of customers, number of items sold).
E. Understanding Data Analysis: Descriptive vs. Inferential

- Descriptive Analysis: Summarizes and describes the basic characteristics of data using measures like mean, median, mode, standard deviation, and others.
- Inferential Analysis: Draws conclusions about a population based on a sample, using statistical tests to assess hypotheses and quantify uncertainty.
F. Tools for Describing Data: Central Tendency and Dispersion
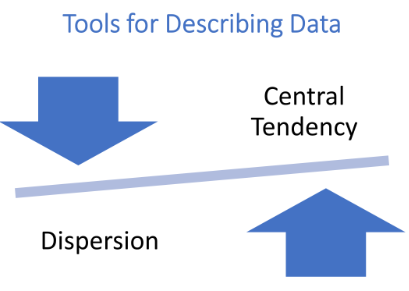
Central Tendency: Measures the “typical” value within a dataset.
- Mean: Sum of all values divided by the number of values.
- Median: Middle value when data is arranged in ascending/descending order.
- Mode: Value that appears most frequently.
Dispersion: Measures how spread out the data is around the central tendency.
- Variance: Average squared deviation from the mean.
- Standard Deviation: Square root of the variance.
- Coefficient of Variation: Relative measure of dispersion, expressed as a percentage.
Illustration: Calculating the mean, median, and standard deviation for a set of customer ages will describe the typical customer age and how spread out the ages are within the customer base.
G. Decision-Making with Expected Values:
- Expected value: Represents the average value of a random variable, considering all possible outcomes and their probabilities.
- Used in decision-making under uncertainty to estimate the average outcome of different choices, facilitating informed decisions.
Illustration: Calculating the expected value of profit considering different sales scenarios and their associated probabilities helps businesses choose the marketing strategy with the highest expected return.
H. Demystifying the Normal Distribution:

A bell-shaped curve representing a continuous probability distribution.
- Most data tends to cluster around the mean, with fewer instances as you
- Most data tends to cluster around the mean, with fewer instances as you move further away in either direction.
- Properties:
- Symmetrical around the mean.
- Total area under the curve equals 1.
- Defined by two parameters: mean (µ) and standard deviation (σ).
- 68% of data falls within 1 standard deviation of the mean, 95% within 2 standard deviations, and 99.7% within 3 standard deviations.
I. Interpreting Normal Distribution Graphs and Tables:
- Graphs: Visually depict the bell-shaped curve, with the x-axis representing data values and the y-axis representing probability density.
- Tables: Show the probability of a value falling within a specific range, expressed as cumulative probability or z-scores (standardized values).
Illustration: A normal distribution graph for customer ages of a clothing store might show a peak around 25-35 years old, indicating the largest customer segment, with fewer customers in younger and older age groups. A z-score table can be used to determine the percentage of customers younger than 20, for example.
Remember:
- Not all data follows a normal distribution. Other distributions (e.g., skewed, uniform) might be more appropriate for some datasets.
- Understanding normal distribution properties helps interpret statistical tests and make informed decisions based on data analysis.
This concludes the in-depth exploration of data summarizing, analyzing, and utilizing information. Remember, this is just the beginning of your journey in statistical literacy. Further exploration of advanced statistical techniques like hypothesis testing, regression analysis, and data mining can equip you with even more powerful tools for extracting insights and making data-driven decisions in the ever-evolving world of business.
Topic 4. Spreadsheets
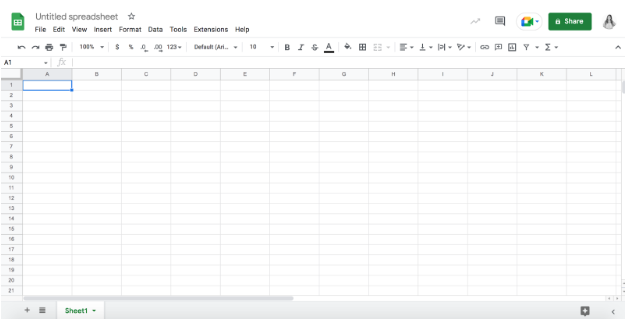
In the digital age, computer spreadsheets have become ubiquitous tools for data analysis, cost and management accounting. This in-depth exploration delves into the role and features of spreadsheet systems, highlighting their diverse applications and empowering you to leverage their potential for impactful data manipulation.
A. Unveiling the Spreadsheet System: Role and Features
Role:
- Organize, store, and manipulate data in a tabular format.
- Perform calculations and automate repetitive tasks using formulas and functions.
- Create charts and graphs to visualize data insights.
- Generate reports and share data analysis results.
Key Features:
- Cells: Building blocks of a spreadsheet, holding individual data points or formulas.
- Rows and Columns: Organize cells into a grid structure for easy identification and analysis.
- Formulas and Functions: Automate calculations using built-in or user-defined formulas, offering diverse functionalities (e.g., mathematical, statistical, logical).
- Formatting: Enhance data presentation with color, borders, fonts, and other formatting options.
- Charts and Graphs: Visualize data trends and relationships using various chart types (e.g., bar charts, line charts, pie charts).
- Filters and Sorting: Focus on specific data subsets for focused analysis and identification of key patterns.
- PivotTables: Summarize and analyze large datasets efficiently, enabling insightful cross-tabulations and aggregations.
B. Beyond Numbers: Diverse Applications
Data Analysis:
- Clean and prepare data for analysis.
- Calculate descriptive statistics (mean, median, standard deviation).
- Perform hypothesis testing and statistical analyses.
- Model relationships between variables using regression analysis.
- Explore data trends and patterns through visualization techniques.
Cost Accounting:
- Budget development and cost forecasting.
- Variance analysis and cost control.
- Activity-based costing calculations and analysis.
- Product costing and profitability analysis.
- Track and analyze key cost drivers and performance metrics.
Management Accounting:
- Prepare management reports and financial statements.
- Analyze profitability and financial performance.
- Track and evaluate budgets and variances.
- Perform ratio analysis and identify key financial trends.
- Develop and implement decision-support models.
C. Illustration: From Data to Insight
Imagine analyzing monthly sales data in a spreadsheet. You can calculate average sales, identify seasonal trends using line charts, compare sales performance across different products using bar charts, and filter data by region to assess regional variations. This empowers you to gain valuable insights into your business performance and make informed decisions about marketing strategies, resource allocation, and product offerings.
Remember:
- Mastering spreadsheet skills requires practice and exploring their diverse functionalities.
- Choose the right tool for the job: different spreadsheet software (e.g., Microsoft Excel, Google Sheets) offer varying features and capabilities.
- Data integrity is crucial: ensure accuracy and consistency of data input for reliable analysis.
- Communication is key: present your spreadsheet analysis in a clear, concise, and visually appealing manner for effective communication of insights.
This exploration equips you with a foundational understanding of the power and diverse applications of spreadsheet systems. Remember, the journey continues with exploring advanced features like macros, data validation, and integration with other business applications, empowering you to unlock even greater potential for data analysis and informed decision-making within your organization.