F5 – Chapter 1: Management Information Systems and Data Analytics
Management Information Systems and Data Analytics
Key Highlights on Chapter 1
Management Information System (MIS):
- Designed to collect, process, and report information for decision-making.
- Supports managerial decision-making by providing necessary information.
- Key function: collecting, processing, and presenting data from various sources.
Data Analytics in MIS:
- Improves decision-making through data analysis.
- Utilizes statistical and analytical techniques.
- Extracts insights from data sets for informed decision-making.
Characteristics of Good Quality Information:
- Timeliness, completeness, accuracy, relevance, reliability.
- Objective and free from subjectivity to ensure reliability.
Decision Support System (DSS):
- Assists managers in semi-structured and unstructured decision-making.
- Provides tools and models for data analysis.
- Aids in analyzing complex data for decision-making purposes.
Components of MIS:
- Hardware, software, data, procedures, people.
- Corporate strategy influences but is not a component of MIS.
Benchmarking:
- Provides baseline for evaluating and improving performance.
- Compares processes and performance metrics with competitors or industry leaders.
Data Visualization:
- Presents data visually for easy understanding.
- Enhances comprehension and communication of insights.
Key Performance Indicators (KPIs):
- Measurable values indicating organizational performance.
- Used to evaluate success in achieving business objectives.
Data Mining:
- Extracts insights and patterns from large datasets.
- Utilizes statistical techniques and algorithms.
Knowledge Management:
– Facilitates sharing and utilization of knowledge.
– Enhances efficiency, innovation, and decision-making.
Structured Data:
– Organized data with defined categories and formats.
– Examples include sales transactions in tables or databases.
Geographic Information System (GIS):
– Analyzes spatial data and geographic information.
– Helps in decision-making related to location-based information.
Supply Chain Management (SCM) System:
– Optimizes flow of goods and services from suppliers to customers.
– Improves efficiency and reduces costs in supply chain processes.
Customer Relationship Management (CRM) System:
– Analyzes customer demographics and preferences.
– Manages interactions with current and potential customers.
Artificial Intelligence (AI) in MIS:
– Improves decision-making through data analysis and prediction.
– Provides insights and recommendations for informed choices.
Benefits of MIS Implementation:
– Improved decision-making, operational efficiency, strategic planning.
– Enhanced data security through centralized storage and access controls.
Business Intelligence (BI) Role:
– Improves decision-making by providing insights from data analysis.
– Utilizes technologies and applications for data collection and integration.
Data Warehouse Purpose:
– Stores and consolidates data from various sources for analysis.
– Provides unified platform for decision-making and reporting.
Enterprise Resource Planning (ERP) System:
– Integrates and manages core business processes and functions.
– Automates finance, HR, procurement, and inventory management.
Challenges of MIS Implementation:
– Lack of user training and adoption.
– Resistance to change and cultural barriers.
– Overcoming challenges essential for successful implementation.
Topic 1: Management Information Systems
A) Role of Information Systems in Organizations:
Information Systems (IS) play a crucial role in organizations by:
- Facilitating information capture, storage, retrieval, and manipulation: Streamlining data collection and analysis for informed decision-making.
- Enhancing communication and collaboration: Enabling efficient and secure information sharing across teams and departments.
- Supporting operational efficiency: Automating and optimizing workflows, minimizing errors, and improving productivity.
- Providing competitive advantage: Enabling better analysis of market trends, customer behavior, and competitor strategies.
- Enhancing decision-making: Providing comprehensive data and reports for informed and timely decisions.
Illustration: A retail company implements a point-of-sale system that captures sales data in real-time. This data can be analyzed to understand customer preferences, optimize inventory management, and tailor marketing campaigns, ultimately achieving a competitive edge.
B) Costs and Benefits of Information Systems:
Costs:
- Hardware and software acquisition: Initial investment in servers, software licenses, and user devices.
- Implementation and maintenance: Costs associated with system setup, training, ongoing upgrades, and technical support.
- Security and data integrity: Expenses incurred in safeguarding systems from cyber threats and ensuring data accuracy.
Benefits:
- Improved operational efficiency: Cost savings achieved through automation, process optimization, and reduced errors.
- Enhanced decision-making: Improved return on investment (ROI) through data-driven decisions leading to better resource allocation and strategic planning.
- Increased productivity: Reduced time spent on manual tasks, empowering employees to focus on value-added activities.
- Improved customer service: Faster response times, personalized experiences, and enhanced customer satisfaction.
Illustration: A manufacturing company implements an Enterprise Resource Planning (ERP) system, integrating production, inventory, and finance functions. This can lead to cost savings in inventory management, improved production planning, and streamlined financial reporting, ultimately outweighing the initial investment.
C) Uses of Internet, Intranet, Wireless Technology, and Networks:
- Internet: Provides access to global information resources, facilitates online communication and collaboration, and enables e-commerce.
- Intranet: A secure internal network used for sharing information, resources, and communication within an organization.
- Wireless technology: Enables mobile access to information and applications, enhancing flexibility and collaboration.
- Networks: Connect computers and devices, allowing for data sharing and communication within and across organizations.
Illustration: A hospital utilizes a secure intranet for sharing patient records, medical protocols, and internal communication among healthcare professionals. Doctors can remotely access patient information via a secure mobile app using wireless technology, enhancing care delivery and access.
D) Accounting Information Requirements and Information Systems:
Accounting Information Requirements:
- Financial Accounting: Provides information for external stakeholders (investors, creditors) about financial performance and position.
- Management Accounting: Provides internal information for planning, control, and decision-making.
Information Systems for Accounting Activities:
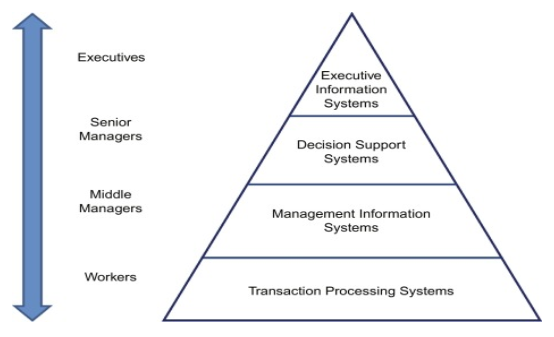
- Transaction Processing Systems (TPS):
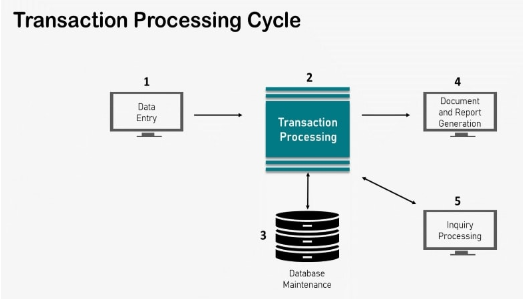
Capture and process routine transactions, such as sales, purchases, and payroll.
- Management Information Systems (MIS): Generate reports and summaries from TPS data to support management control.
- Executive Information Systems (EIS):
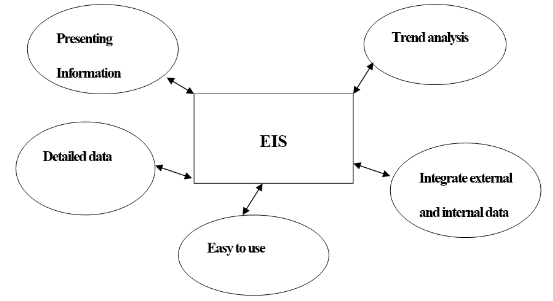
Provide top-level managers with real-time access to key performance indicators (KPIs) and critical information.
- Enterprise Resource Planning (ERP) Systems:
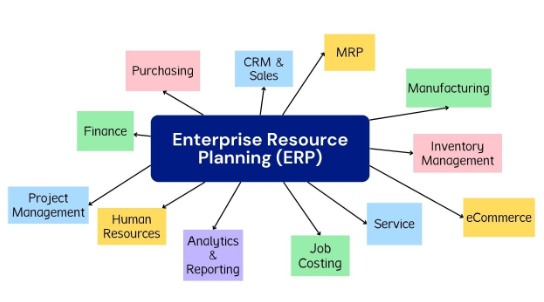
Integrate financial, operational, and other business functions, providing a holistic view of the organization.
- Customer Relationship Management (CRM) Systems:
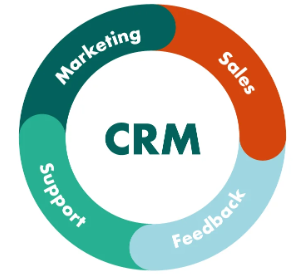
Manage customer interactions, store customer data, and personalize marketing and sales efforts.
Illustration: An organization uses a TPS to record customer sales, which are then summarized by the MIS to generate sales reports for management control. The CEO utilizes an EIS for real-time insights into sales performance, while the ERP system integrates financial data with sales and inventory information.
E) Defining and Discussing Information Systems:
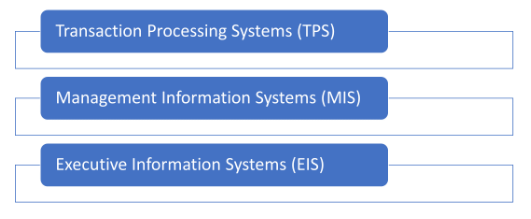
- Transaction Processing Systems (TPS): Capture, store, and process routine transactions in real-time, ensuring accuracy and efficiency. (e.g., Point-of-sale systems, payroll systems)
- Management Information Systems (MIS): Generate reports and summaries from TPS data for management control, supporting decision-making and planning. (e.g., Sales reports, inventory reports)
- Executive Information Systems (EIS): Provide top-level managers with real-time access to key performance indicators (KPIs) and critical information, presented in a user-friendly format. (e.g., Dashboards, scorecards)
Topic 2: Uses and Control of Information
A) Principal Sources of Management Information for Control Purposes:
Several sources of information can be used for control purposes:
- Financial statements: Provide insights into financial performance and financial health, enabling monitoring of profitability, liquidity, and solvency.
- Management reports: Generated from MIS, capturing operational data and performance metrics like sales, production, and costs, enabling comparison to budgets and targets.
- Performance dashboards: Visualize key performance indicators (KPIs) in real-time, allowing for quick identification of variances and areas requiring attention.
- Benchmarking: Comparing an organization’s performance with industry standards or best practices, highlighting areas for improvement and potential weaknesses.
Illustration: A company monitors its financial statements to assess profitability and solvency. Management reports track production costs and compare them to budget targets. A performance dashboard displays real-time sales figures and highlights any significant deviations from forecasts. By analyzing this information, management can identify areas requiring corrective action or adjustment of strategies.
B) Principal Controls Required in Generating and Distributing Internal Information:
- Data accuracy and completeness: Ensure data is free from errors and captures all relevant information.
- Data security: Implement access controls, encryption, and other measures to protect sensitive information from unauthorized access.
- Change control: Establish procedures for authorizing, documenting, and implementing changes to data and systems.
- User access control: Grant access to information based on the principle of least privilege, restricting access to authorized users only.
- Audit trails: Maintain a record of user activities and data modifications for audit purposes and accountability.
Illustration: A company implements data validation rules in its systems to ensure accurate data entry. Access controls restrict unauthorized users from viewing or modifying confidential financial information. Change control procedures require approval for any system modifications, accompanied by proper documentation.
C) Controls and Procedures for Highly Confidential Information:
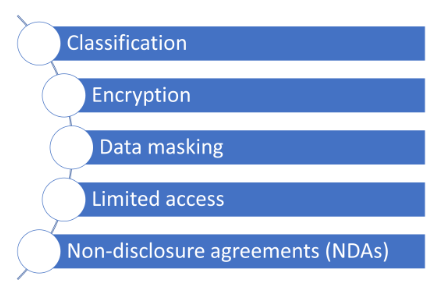
- Classification: Classify information based on its confidentiality level (e.g., top secret, confidential).
- Encryption: Encrypt sensitive data at rest and in transit to protect it from unauthorized access.
- Data masking: Mask or redact sensitive data in reports and outputs to minimize exposure.
- Limited access: Grant access to highly confidential information only to personnel with a legitimate need-to-know basis.
- Non-disclosure agreements (NDAs): Require employees and contractors handling confidential information to sign NDAs.
Illustration: A company classifies customer financial data as confidential. This data is encrypted at rest and in transit, and only authorized personnel have access to the information. Reports containing such data may mask specific details to minimize exposure while still providing relevant insights.
D) Importance of Data Visualization in Management Information:
Data visualization plays a crucial role in presenting information:
- Improved comprehension: Visual representations like charts, graphs, and maps can simplify complex data sets, making them easier to understand and interpret.
- Identification of trends and patterns: Visualizations can highlight trends, patterns, and outliers in data, enabling faster identification of areas requiring attention or further analysis.
- Enhanced communication and decision-making: By presenting information in a clear and concise format, data visualizations facilitate communication and collaboration, allowing stakeholders to make informed decisions based on readily understood insights.
Illustration: A company presents sales data in a bar chart, enabling quick comparison of sales performance across different regions. A line graph visually depicts the trend in production costs over time, highlighting potential cost increases that require investigation. These visualizations aid managers in understanding complex information and making data-driven decisions.
Topic 3: Big Data and Data Analytics
A) Characteristics of Big Data (5Vs):
Big data is characterized by five key dimensions:
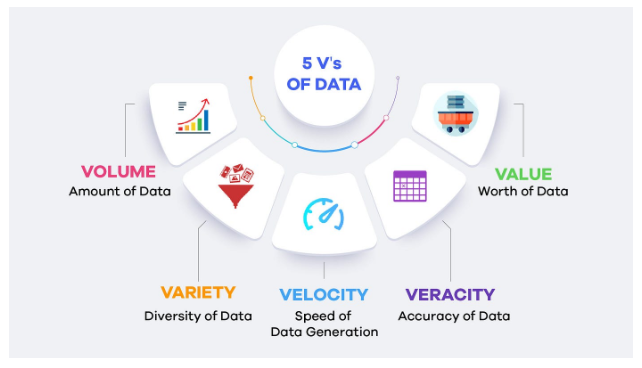
- Volume: The massive amount of data generated from various sources, including transactions, social media, sensor data, and machine logs.
- Velocity: The speed at which data is created and processed, often requiring real-time or near-real-time analysis.
- Variety: The diverse nature of data, including structured (e.g., databases), semi-structured (e.g., emails), and unstructured (e.g., social media text).
- Veracity: The accuracy, completeness, and consistency of data, requiring cleaning and validation to ensure its reliability.
- Value: The potential of data to be analyzed and transformed into insights that can drive business value and improve decision-making.
Illustration: A retail company collects transaction data, customer clickstream data from its website, and social media sentiment analysis, representing the volume and variety of big data. This data needs to be processed swiftly (velocity) and validated for accuracy (veracity) to extract valuable insights (value) for marketing campaigns and product development.
B) Purpose of the Big Data Pyramid (Data, Information, Knowledge, Wisdom):
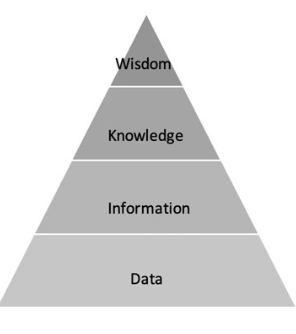
The big data pyramid represents a hierarchical framework for understanding the transformation of raw data into actionable insights:
- Data: The lowest level, comprising the raw, unprocessed information collected from various sources.
- Information: Data organized and contextualized to provide specific meaning and understanding. This involves cleaning, organizing, and structuring raw data.
- Knowledge: Derived from analyzing and interpreting information to identify patterns, relationships, and insights. This requires applying analytical techniques and domain expertise.
- Wisdom: The highest level, encompassing the ability to use knowledge to make sound decisions and judgments in complex situations. This involves critical thinking, ethical considerations, and applying knowledge to real-world problems.
Illustration: A company collects customer purchase data (data). By analyzing this data, it can gain information about customer preferences and buying patterns. Through further analysis and combining this information with other relevant data points, the company can gain knowledge about customer segments and their behavior. Applying this knowledge and business context allows the company to make wise decisions regarding product offerings, marketing strategies, and customer segmentation.
C) Uses and Benefits of Big Data, Data Mining, and Data Analytics:
Predictive analytics: Analyze historical data to predict future trends, customer behavior, and potential risks, enabling informed decision-making.
- Customer segmentation: Identify distinct customer groups based on their characteristics and preferences, allowing for targeted marketing campaigns and personalized experiences.
- Operational efficiency: Analyze operational data to identify areas for improvement, optimize processes, and reduce costs.
- Risk management: Analyze data to assess and mitigate potential risks, such as financial fraud or operational disruptions.
- Product development: Analyze customer data and market trends to develop new products and services that meet customer needs and preferences.
Illustration: A company uses data analytics to predict future purchase patterns and personalize product recommendations for each customer. Operational data analysis helps identify inefficiencies in the production process, leading to cost savings and improved efficiency.
D) Challenges and Risks of Implementing and Using Big Data and Data Analytics:
- Cost: Requires significant investment in technology, infrastructure, and skilled personnel to collect, manage, and analyze big data effectively.
- Security and privacy: Protecting sensitive data from unauthorized access or breaches requires robust security measures and adherence to data privacy regulations.
- Data quality: Ensuring data accuracy, completeness, and consistency is crucial for reliable insights.
- Skills and expertise: Requires skilled professionals who can manage, analyze, and interpret big data effectively.
- Ethical considerations: Responsible use of data analytics is essential, ensuring transparency and avoiding discriminatory practices based on the data analysis.
Illustration: Implementing a big data analytics project can be expensive, requiring investments in hardware, software, and data scientists. Balancing the need for data analysis with data privacy regulations is crucial. The accuracy of the insights derived from big data analytics is highly dependent on the quality of the data used.